The Covid-19 pandemic rages around the world, hitting cities in Asia, Europe and the U.S. in waves: first Wuhan, then Milan and Madrid, and now Seattle, New York City, Detroit and New Orleans. No place seems immune. But some cities seem more vulnerable to its devastating spread, and more vulnerable to the virus’s most insidious impacts.
In trying to understand the factors that exacerbate this pandemic, a chorus of commentators examining the trajectory have been quick to blame density. As with the September 11 terrorist attacks and the economic crisis of 2008, they see the virus as setting in motion a great migration away from dense, populous urban centers, effectively putting an end to the back-to-the-city movement of the past couple of decades.
Density is a factor in this pandemic, as it has been in previous ones. The very same clustering of people that makes our great cities more innovative and productive also makes them, and us, vulnerable to infectious disease.
Yet, density is likely just one of a number of key factors that determine how vulnerable places are to the virus. Across the world, Covid-19 has taken root and hit hard in several types of places. One is large dense superstar cities like New York and London, with large flows of visitors and tourists, diverse global populations and dense residential areas. A second is industrial centers like Wuhan, Detroit, and Northern Italy, which are connected through supply chains. The third is global tourist meccas like the ski slopes of Italy, Switzerland and France, and their counterparts in the Colorado Rockies. And in smaller communities, the virus targeted nursing homes and funeral parlors, and of course cruise ships, which are like dense small cities at sea.
There is no simple, one-size-fits-all explanation when it comes to cities and the virus. It is important to distinguish the unfortunate hot spots where it first cropped up from the characteristics of places that may propagate, or limit, its spread. Cities differ along many dimensions — population size, age, education level, affluence, religiosity, the kinds of work people do, levels of social capital, and more. All of these factors and others may affect their vulnerability to the coronavirus.
It is frequently said that early lockdowns and social distancing measures — work-from-home orders, closing of schools and shelter-in-place edicts — are helping to tamp down the pandemic in some cities. There is no doubt that such measures have played a significant role in flattening the curve. Indeed, a number of hyper-dense Asian cities — Singapore, Seoul, Hong Kong and Tokyo — have succeeded in managing the outbreak, though they may be vulnerable to later flare-ups.
But there may be other dimensions of these cities that have also helped to make certain places more or less vulnerable.
Although the pandemic is global, I zero in mainly on the geography of Covid-19 in the U.S. using data developed by the New York Times and inspired by analyses by Jed Kolko, Joe Cortright, and Bill Bishop.
A few caveats are in order. It is still early days, and the data on the spread of the virus remains spotty, due to variations in testing and other factors. We also have only a limited sample of cities to draw on, with a few that are through the worst phases of the epidemic, some that are in the middle of it, and potentially many more yet to be affected. And because this analysis focuses on U.S. data, it may overlook factors that are relevant in other global cities.
The chart below by Kolko shows the Covid-19 death rate by type of county as of April 1. Large urban counties not surprisingly top the list, falling off by degree of density, from their high-density suburbs down to the rural areas.

But rural America is not immune. In fact, while the overall rates of cases and deaths have thus far been lower, Covid-19 is now spreading through rural America at about the same speed as in urban areas, according to Bill Bishop and Tim Marena of the Daily Yonder. The virus has hit particularly hard at a subset of rural areas referred to as rural recreation counties, according to their analysis. These are places have a high degree of natural amenities — lake and waterfronts, beautiful countryside, or ski slopes — that lure lots of wealthy travelers and tourists. Such places include Eagle and Pitkin counties in Colorado; Summit County, Utah; and Blaine County, Idaho. Wood River Valley, a community of just 22,000 people in the heart of Idaho’s ski country, had 192 cases and 2 deaths earlier this week, with a greater share of its population testing positive than New York City, according to the Washington Post.
On the whole, rural recreation counties suffer from a rate of Covid-19 cases that is more than two and a half times higher than for other rural counties, according Bishop and Marena.
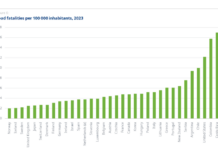
The next chart, also by Kolko, shows the U.S. metro areas that have suffered the highest death rates from Covid-19. (Even with variations in testing, deaths remain the best barometer of the effect of the Covid-19 crisis.)

Four of the 10 are large dense metros: New Orleans, New York, Seattle and Detroit. But other metros on this list defy the density narrative. In the small metro of Albany, Georgia, for example, the virus spread through two funerals.
As to the question of density itself: Kolko’s analysis finds density to be significantly associated with Covid-19 deaths across U.S. counties. But density is not the only factor at play. His analysis also finds that Covid-19 death rates per capita are higher in counties with older populations and larger shares of minorities, and colder, wetter climates. It’s important to remember that this analysis only looks at the U.S., and in other parts of the world, denser cities have had more success controlling the spread.
But even in the U.S., it is not density in and of itself that seems to make cities susceptible, but the kind of density and the way it impacts daily work and living. That’s because places can be dense and still provide places for people to isolate and be socially distant. Simply put, there is a huge difference between rich dense places, where people can shelter in place, work remotely, and have all of their food and other needs delivered to them, and poor dense places, which push people out onto the streets, into stores and onto crowded transit with one another.
This density divide is vividly apparent in geographic breakdown of the virus across New York City: Covid-19 is hitting hardest not in uber-dense Manhattan but in the less-dense outer boroughs, like the Bronx, Queens, and even far less dense Staten Island.
The density that transmits the virus is when people are crammed together in multifamily, multi-generational households or in factories or frontline service work in close physical proximity to one another or the public. Such density is why the earlier 1918 flu pandemic ravaged the working-class neighborhoods of industrial centers of Pittsburgh and Philadelphia.
There are a number of other factors in addition to density that merit closer attention as we continue to track the virus’s spread. Two obvious one are the age of population and pre-existing health conditions like smoking, obesity, diabetes and heart disease. It is critically important to look closely at the uneven impact of the virus on poor and minority communities. We’ll also want to zero in the differences in the kinds of work people do: the shares of the workforce that are able to engage in remote work versus the share of frontline workers in health care, delivery and grocery stores that are particularly vulnerable to the virus. We may also find that high levels of religiosity, where people gather in large groups to worship, or places with large shares of multi-generational families also have greater vulnerability. In a divided nation like ours, it will be interesting to see to what degree political orientation matters: Blue states and cities have tended to move much quicker on social distancing that their Red counterparts.
We may find that some things we want to encourage in cities, like tight social bonds and civic capital, make them more vulnerable. “When it’s all said and done, we’re going to find that COVID was uniquely lethal to people with high social capital,” demographer Lyman Stone suggested on Twitter. Conversely, we may also find that some things people criticize cities for — like childlessness, relatively few children and low levels of families with kids — worked to protect them, for the simple reason that kids can be vectors for the disease’s spread.
Some of these factors may also help explain why San Francisco, the second-densest place in the U.S. after New York City, appears to have had more success in flattening its curve. It may not just be that San Francisco locked down earlier than other places, though that certainly helped. With fewer children per capita, a higher rate of remote workers who can shelter in place, and one of the highest rates of educational attainment in the U.S., the city may have a list of factors that made it more resilient than Detroit, New Orleans or even New York, which are far more diverse across class and demographic lines.
The full impact of the Covid-19 pandemic on our geography and our cities remains to be seen. Distressingly, it appears that the virus may reinforce some key faultiness of our existing economic and geographic divides.


